Table of Contents
- What standards govern expandable microsphere testing?
- How is thermal expansion behavior characterized?
- How are expandable microspheres classified by expansion temperature?
- What is the role of DSC and TGA in microsphere testing?
- How is the expanded morphology examined?
- How is density and mechanical performance measured?
- What failure modes does testing catch?
- FAQ
- Our expandable microsphere testing service
What standards govern expandable microsphere testing?
Expandable microsphere testing is unusual among polymer-additive tests because no single dedicated standard covers the product. The test programme is assembled from the plastics thermal-analysis and mechanical-testing standards that the relevant properties are measured under, plus the application-specific standards the foam or composite is qualified against. A test report that quotes only the application standard, without naming the thermal-analysis methods, is unverifiable.
The principal reference standards our laboratory works to are:
- ISO 11359, Plastics — Thermomechanical analysis (TMA) (ISO 11359-1) — the TMA method standard. Part 1 covers the general principles; the method is the one used to measure the expansion-temperature behaviour of the microsphere, because TMA tracks dimensional change as a function of temperature and the expansion is a dimensional change.
- ISO 11357, Plastics — Differential scanning calorimetry (DSC) (ISO 11357-3:2018) — the DSC method standard. Part 3 specifies the determination of melting and crystallization temperatures and enthalpies; Part 1 the general principles. DSC is used to characterize the shell polymer's glass transition, the blowing-agent vaporization, and (for the foamed matrix) the crystallinity.
- ISO 11358, Plastics — Thermogravimetry (TGA) of polymers — the TGA method standard, used to determine the blowing-agent content, the shell polymer fraction and the yielded-gas volume from the weight-loss curve.
- ASTM D638, Standard Test Method for Tensile Properties of Plastics — the tensile-test standard for the foamed or composite specimens the microspheres are incorporated into, used alongside the equivalent ISO 527.
- ASTM D256, Standard Test Methods for Determining the Izod Pendulum Impact Resistance of Plastics — the impact-test standard for the foamed specimens.
- ISO 1183, Plastics — Methods for determining the density of non-cellular plastics and the Archimedes water-displacement method — used for the density measurement that quantifies the expansion ratio.
The product itself — the expandable microsphere — is sold under manufacturer grade designations (Expancel, Matsumoto Yushi-Seiyaku F-series, Dongjin PG-series, Tracel, Kureha) rather than under a public product standard. The grade datasheet carries the manufacturer's declared Tstart, Tmax, particle-size distribution and expansion ratio, and the laboratory's job is to verify that the as-received lot matches the declared properties under the ISO method standards. A conformity project that quotes only the grade name, without the ISO methods used to verify the datasheet values, is a marketing document rather than a test report.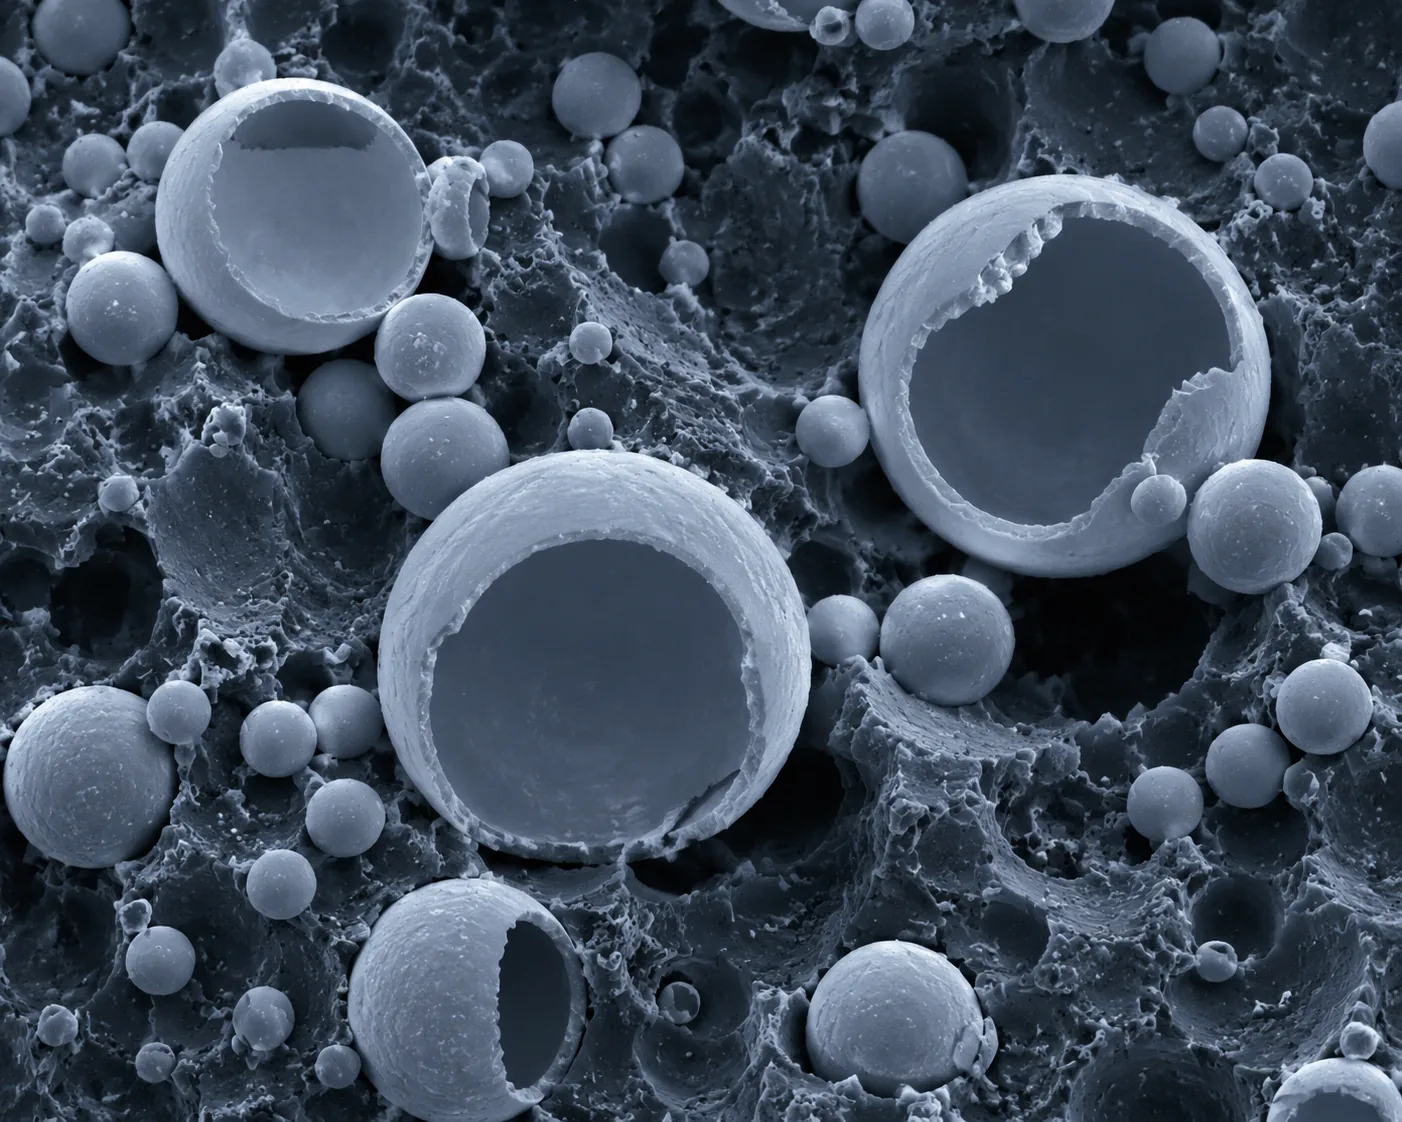
How is thermal expansion behavior characterized?
The defining measurement of an expandable microsphere is its thermal expansion curve — the dimensional change as a function of temperature, from which the expansion-temperature parameters are derived. The measurement is made by thermomechanical analysis (TMA) under ISO 11359.
A representative procedure, drawn from the published microsphere literature, runs as follows. A small sample (on the order of tens of micrograms) is placed in the TMA sample cup and heated from ambient to 250 °C at a defined rate (5 °C/min is common). A probe with a small preload force rests on the sample and tracks the dimensional change as the temperature rises. The resulting curve divides into four phases that together define the expansion behaviour:
- Phase I — pre-expansion plateau. Below the shell-softening temperature, the microsphere is rigid and the probe displacement is essentially constant. The hydrocarbon blowing agent inside the shell has begun to vaporize (its boiling point is well below the shell softening point), but the shell polymer has not yet softened enough to yield, so the internal pressure cannot deform the sphere.
- Phase II — expansion. As the shell polymer reaches its viscoelastic state, the internal pressure from the vaporized blowing agent exceeds the mechanical strength of the softened shell, and the microsphere expands. The TMA curve rises. The temperature at which the rise begins is the Tstart (activation temperature); the temperature at which the dimensional change reaches its maximum is the Tmax (maximum expansion temperature); the dimensional change at Tmax is the Dmax (maximum expansion).
- Phase III — collapse. Beyond Tmax, a fraction of the microspheres rupture — the shell has become too soft to retain the gas, the blowing agent escapes, and the expanded sphere contracts. The TMA curve falls. This is the phase that process control must avoid: a microsphere processed above its Tmax collapses rather than expands.
- Phase IV — residual plateau. The displacement stabilizes once the rupturing fraction has ruptured and the surviving expanded spheres are packed in the melt. Further heating does not change the displacement significantly until the polymer decomposes.
The three parameters — Tstart, Tmax, Dmax — are the datasheet values that grade selection is made against, and they are the values a conformity report verifies. Representative values from the published literature illustrate the spread: a low-temperature grade with Tstart near 121 °C and Tmax near 171 °C; a medium-temperature grade with Tstart near 144 °C and Tmax near 202 °C; a high-temperature grade with Tstart near 167 °C and Tmax near 245 °C. The differences reflect differences in the shell polymer composition — the shell's softening point sets Tstart, and the shell's melt strength sets Tmax.
The Dmax value is the indicator of the grade's expansion potential — the larger the Dmax, the larger the volume increase the grade is capable of. But Dmax is measured in free expansion (the microsphere expanding in air, in the TMA cup), and in service the microsphere expands against the pressure of the polymer melt it is dispersed in. A grade with a large free-expansion Dmax may produce a smaller expansion in a viscous HDPE melt than a grade with a smaller Dmax in a low-viscosity matrix, because the melt pressure resists the expansion. This is why the TMA curve is the starting point of grade selection, not the endpoint — the final expansion is confirmed in the matrix, not in the TMA.
How are expandable microspheres classified by expansion temperature?
Expandable microspheres are classified by their Tmax into three temperature categories, and the category is the first selection filter when a grade is chosen for an application. The classification, drawn from the peer-reviewed literature, is:
- Low-temperature grades — Tmax below approximately 120 °C. These grades activate and reach peak expansion at temperatures compatible with heat-sensitive substrates — thermoset resins that cure below 120 °C, low-melting thermoplastics, and coatings that cannot tolerate higher cure temperatures.
- Medium-temperature grades — Tmax in the 120 to 180 °C range. These grades are the workhorses for the common thermoplastics — polypropylene, polyethylene, PVC — whose processing temperatures sit in this band.
- High-temperature grades — Tmax above 180 °C. These grades are specified for engineering thermoplastics and matrix materials that process at the higher temperatures — polyamide, polycarbonate, polyester, and the structural composite matrices — where a low-Tmax grade would collapse before the matrix was ready to receive it.
The selection logic that ties the category to the application is direct: the processing-temperature window of the matrix must lie between the Tstart and the Tmax of the microsphere, with margin on both sides. If the processing temperature is below Tstart, the microsphere does not activate and no expansion occurs. If the processing temperature is above Tmax, the microsphere collapses — the shell ruptures, the blowing agent escapes into the matrix, and the void the microsphere was meant to create either does not form or forms and then collapses. Either failure mode defeats the purpose of adding the microsphere.
A worked example from the published literature makes the logic concrete. For a high-density polyethylene processed at nozzle temperatures of 190 to 220 °C, the medium-temperature grade (Tstart 144 °C, Tmax 202 °C) is the correct match: the processing window sits between Tstart and Tmax with margin at 190 °C, and exceeds Tmax at 220 °C — which is exactly the behaviour the mechanical data confirms, with the foam collapsing at the 220 °C nozzle temperature as the microspheres rupture. A low-temperature grade (Tmax 171 °C) would collapse across the entire HDPE processing window; a high-temperature grade (Tmax 245 °C) would barely activate at 190 °C and would under-expand. The grade selection is not a matter of "higher temperature is better" — it is a matter of matching the Tmax band to the processing window.
This is why the conformity project for an expandable microsphere lot is not only a verification of the declared Tstart and Tmax against the ISO 11359 method, but a confirmation that those parameters are appropriate to the matrix the lot is destined for. A lot that conforms to its datasheet can still be the wrong grade for the application, and the grade-application match is a question the laboratory can help answer with the expansion-curve data.
What is the role of DSC and TGA in microsphere testing?
The TMA expansion curve characterizes the expansion behaviour, but it does not by itself explain the shell polymer or the blowing-agent content. Two further thermal-analysis methods supply the missing information: DSC for the shell-polymer transitions, and TGA for the composition breakdown.
Differential scanning calorimetry (DSC) under ISO 11357 measures the heat flow into or out of the sample as a function of temperature. For an expandable microsphere, the DSC curve shows two characteristic features. First, an endothermic peak corresponding to the vaporization of the hydrocarbon blowing agent inside the shell — the heat absorbed as the liquid hydrocarbon converts to gas. Second, where the shell polymer is semi-crystalline or has a detectable glass transition, the corresponding thermal events. The onset temperature of the blowing-agent endotherm is typically lower than the Tstart measured by TMA — a finding that has diagnostic value: it confirms that the blowing agent vaporizes before the shell softens, and that the expansion is gated by the shell-softening event rather than by the vaporization. A microsphere whose DSC shows the blowing-agent endotherm at a temperature above the TMA Tstart would indicate a formulation anomaly worth investigating.
For the foamed matrix (the polymer the microsphere is dispersed in), DSC measures the melting enthalpy and the crystallinity, which the expansion directly affects. Published data on HDPE foamed with thermal-expansion microspheres shows the crystallinity dropping from 62.78 % to 53.81 % as the microsphere content rises from 0 to 4.5 wt%, and the melting peak temperature shifting down from 116.89 °C to 113.91 °C. The crystallinity drop is the mechanism by which the microsphere addition degrades the Young's modulus and the tensile strength of the foam — the voids the microspheres introduce disrupt the crystal structure — and the DSC measurement is what quantifies the mechanism. A mechanical-test result on a foamed sample without the corresponding DSC crystallinity data is a number without an explanation.
Thermogravimetric analysis (TGA) under ISO 11358 measures the sample mass as a function of temperature, and the weight-loss curve is the composition breakdown of the microsphere. A representative yielded-gas volume from the TGA weight-loss is on the order of 24 mL/g, and the breakdown by mass for a typical masterbatch-form microsphere may be roughly 18 % effective gas (the blowing agent), 16 % shell polymer, 37 % carrier polymer (for masterbatch grades), and 25 % silica stabilizer — the exact figures vary by grade and formulation. The TGA is the measurement that confirms whether the blowing-agent content of the lot matches the datasheet, and it is the measurement that supplies the yielded-gas volume used to calculate the theoretical foam density.
For isothermal work — where the question is how much gas a microsphere yields at a specific processing temperature held for a specific time — the TGA is run isothermally at the processing temperature (190 °C, 210 °C, 230 °C, for example), and the weight-loss-over-time curve is the gas-yield-over-time. This is the measurement that catches a microsphere whose blowing agent escapes too fast at the processing temperature — a failure mode that produces under-expanded foam even when the Tmax is nominally appropriate.
How is the expanded morphology examined?
The expansion-curve and thermal-analysis data describe the microsphere. The morphology examination describes the expanded microsphere and the foam it produces — the actual cell structure, the cell size, the cell density, and the uniformity that determines whether the expansion was successful. The instrument is the scanning electron microscope (SEM).
For the expanded microsphere in free expansion, a sample is heated at the target temperature for a defined hold time (commonly 5 minutes at 180 °C, 200 °C, 220 °C), cooled, sputter-coated with gold, and examined at low magnification. The SEM image shows the diameter before and after expansion, and the expansion ratio is calculated directly. A representative result for a medium-temperature grade: an unexpanded diameter of 30 to 40 μm expanding to a peak of around 140 μm at 200 °C, then shrinking as some spheres rupture above Tmax. The free-expansion diameter is larger than the in-matrix diameter at the same temperature, because the polymer melt exerts external pressure that restrains the expansion — a difference worth noting in the report, because it explains why a microsphere that expands to 140 μm in the SEM may produce a 90 μm cell in the foamed HDPE.
For the foamed matrix, the sample is cryogenically fractured in liquid nitrogen to produce a clean brittle-fracture surface that reveals the cell cross-section, sputter-coated, and examined. The SEM image supplies the cell size (the average cell diameter) and the cell density (the number of cells per unit volume). The cell density is calculated from the cell count in a known SEM-image area, corrected for the void fraction and the magnification, using the standard cell-density equation. A representative result for a microcellular HDPE foam: a cell size of approximately 89.72 μm and a cell density of 4.39 × 10⁸ cells/cm³, at a microsphere content of 1.5 wt% and a nozzle temperature of 210 °C.
The SEM morphology is where the failure modes of over-expansion become visible. Below Tmax, the cells are uniform and closed-walled. At Tmax, the cells reach peak diameter with the shell intact. Above Tmax, the SEM shows a mixed population: intact expanded cells, ruptured shells visible as collapsed polymer in the void, and shrinkage cavities where the blowing agent escaped after rupture. The non-uniform morphology is the direct evidence that the processing temperature exceeded the grade's Tmax, and it correlates with the sharp drop in mechanical properties that the over-temperature condition produces. A morphology report without the SEM images is a description; with the images, it is evidence.
How is density and mechanical performance measured?
The expansion produces a foam, and the foam is characterized by its density and its mechanical properties. The density measurement quantifies the expansion ratio; the mechanical tests quantify the price the matrix pays for the density reduction.
Density is measured by the Archimedes water-displacement method, using an analytical balance with a density-determination kit. The sample is weighed in air and in water, and the density is calculated from the two weights and the water density. The measurement is run on at least three specimens per condition and averaged. The density reduction is reported as the percentage drop from the unfoamed matrix density — a representative HDPE foam achieves a density reduction of 5.75 % at 1.5 wt% microsphere content. The density reduction is the figure the lightweighting argument is built on, and it is the figure that must be reported alongside the mechanical-property penalty the microsphere addition imposes.
Tensile properties are measured under ASTM D638 (or the equivalent ISO 527), on specimens machined or molded to the standard geometry. The tensile test supplies the Young's modulus, the ultimate tensile strength, and the elongation at break. Published data on microsphere-foamed HDPE shows the Young's modulus and the tensile strength dropping sharply as the microsphere content rises — from 1330 MPa and 22.8 MPa at 0 wt% to 839 MPa and 15.8 MPa at 4.5 wt% — while the elongation at break rises from 37 % to 41 %. The modulus and strength drop because the voids reduce the effective load-bearing cross-section and because the microsphere addition reduces the matrix crystallinity (the DSC finding). The elongation rise is the consequence of the same crystallinity reduction: the amorphous fraction is more ductile, and the cellular structure accommodates more deformation before fracture.
Impact strength is measured under ASTM D256 (Izod) or ASTM D6110 (Charpy), on notched specimens. The impact strength of the foam typically increases with moderate microsphere content, because the cellular structure absorbs impact energy, and then decreases at higher content as the excessive void density introduces stress-concentration defects. The peak impact strength at the optimum content is the figure that justifies the microsphere addition for energy-absorption applications.
Bending properties are measured under ASTM D790 (or ISO 178), supplying the bending modulus and the bending strength. For the closed-cell foam that intact microspheres produce, the bending strength can be higher than the unfoamed matrix at low microsphere content — the shell's compressive-deformation resistance disperses the bending stress and prevents localized stress concentration. This is the property that makes microsphere foaming attractive for structural applications where bending is the dominant load.
The mechanical-test programme for a microsphere-foamed material is identical in method to the programme for the unfoamed matrix, and the value of the comparison is in running both: the foamed-versus-unfoamed contrast, at each microsphere content and each processing condition, is what quantifies the lightweighting-versus-property trade-off that the grade selection and the process-window optimization are trying to optimize.
What failure modes does testing catch?
The failure modes that expandable microsphere testing addresses are the modes that produce a foam that does not perform as designed — under-expanded, over-expanded, non-uniform, or collapsed. Understanding the modes makes the testing defensible rather than rote, because each test in the programme maps to a specific mode that the test is designed to catch.
Under-expansion — wrong grade or under-temperature. A microsphere processed below its Tstart does not activate, and the matrix contains unexpanded spheres that act as stress-concentration defects rather than as density-reducing cells. The SEM morphology shows the unexpanded 30-40 μm spheres embedded in the matrix; the density reduction is near zero; the mechanical properties are those of the matrix with defects, worse than the unfoamed material. The TMA expansion curve, run on the as-received lot against the declared Tstart, catches the wrong-grade or the off-spec lot before it reaches the process.
Over-expansion — over-temperature collapse. A microsphere processed above its Tmax ruptures, the blowing agent escapes, and the void either does not form or forms and collapses. The SEM morphology shows the non-uniform mixed population of intact and ruptured cells, with the collapsed shells visible inside the voids; the density reduction is lower than expected; the mechanical properties drop sharply because of the non-uniform cell structure. The TMA curve, run to confirm the Tmax against the processing temperature, is the front-line check; the SEM is the confirmation.
Premature activation — storage or transport failure. A microsphere exposed to high temperature in storage or transport may partially activate, losing blowing-agent content before it reaches the process. The TGA weight-loss curve shows a lower-than-declared blowing-agent fraction; the TMA expansion curve shows a reduced Dmax. The lot that has degraded in storage produces under-expanded foam even at the correct processing temperature, and only the thermal-analysis verification of the lot — not the process parameters — catches it.
Non-uniform dispersion — process failure. A microsphere that agglomerates in the matrix, or that is mixed at insufficient shear, produces a foam with clustered cells and unexpanded regions. The SEM morphology shows the agglomerations; the density measurement shows the local density variation. This is a process failure rather than a microsphere failure, but the morphology examination is what identifies it, and the corrective action (dispersion protocol, mixing energy) is informed by the SEM finding.
Shell-polymer incompatibility — formulation failure. A microsphere whose shell polymer is plasticized or swollen by a component of the matrix formulation expands at a different temperature than the datasheet Tstart, or ruptures below the datasheet Tmax. The DSC curve shows the shell transition shifted from the expected position; the TMA expansion curve shows the Tstart and Tmax shifted. This is the failure mode that the chemical-resistance data in the manufacturer's technical guide exists to help avoid, and the laboratory's thermal-analysis confirmation is the check when a new formulation is qualified.
The value of framing the testing in terms of failure modes is that it explains why no single test suffices. A microsphere lot can pass the TMA expansion curve and still fail in service because the TGA shows reduced blowing-agent content, or because the DSC shows a shifted shell transition, or because the SEM of the trial foam shows agglomeration. A complete programme covers the TMA expansion curve, the DSC shell characterization, the TGA composition breakdown, and the SEM morphology of the trial foam — and a competent laboratory reports the result of each test against the failure mode it addresses.
FAQ
Which standards should my expandable microsphere be tested to?
The expandable microsphere itself is characterized under ISO 11359 (TMA) for the expansion curve, ISO 11357 (DSC) for the shell transitions and the blowing-agent endotherm, and ISO 11358 (TGA) for the composition breakdown and the yielded-gas volume. The foamed matrix is tested under ASTM D638 / ISO 527 for tensile, ASTM D256 / D6110 for impact, ASTM D790 / ISO 178 for bending, and the Archimedes method for density. We confirm the test scope against the application — free-expansion verification of the lot, or full foam characterization in a specified matrix — before quoting.
What does the TMA expansion curve tell me?
It gives the three grade-defining parameters: Tstart (the temperature at which expansion begins), Tmax (the temperature at which peak expansion is reached), and Dmax (the dimensional change at peak expansion). These are the values the grade datasheet declares, the values the grade selection is made against, and the values the conformity report verifies. The curve also shows the collapse phase above Tmax, which is the processing window the application must stay within.
How do I select the right microsphere grade for my matrix?
Match the Tmax category to the processing-temperature window of the matrix. Low-temperature grades (Tmax below 120 °C) suit heat-sensitive substrates and low-cure thermosets. Medium-temperature grades (Tmax 120-180 °C) suit the common thermoplastics — PP, PE, PVC. High-temperature grades (Tmax above 180 °C) suit engineering thermoplastics and high-temperature composite matrices. The processing window must sit between Tstart and Tmax with margin on both sides. We can confirm the grade-matrix match with the expansion-curve data and, where useful, with a trial-foam SEM.
Can you test the microsphere in my actual matrix, or only in free expansion?
Both. Free-expansion characterization (TMA on the as-received lot, SEM of microspheres heated in air) verifies the lot against the datasheet. In-matrix characterization (SEM of the foamed matrix, density, mechanical tests on the foam specimens) verifies the expansion in the actual service condition. The two answer different questions and both may be needed — the free-expansion test confirms the lot is as declared, and the in-matrix test confirms the process produces the intended foam.
What happens if my processing temperature exceeds the microsphere's Tmax?
The microsphere ruptures, the blowing agent escapes, and the void either does not form or forms and collapses. The SEM morphology of the foam shows the non-uniform mixed population of intact and ruptured cells; the density reduction is lower than expected; the mechanical properties drop sharply. This is the failure mode that grade selection by Tmax exists to prevent, and the conformity project that verifies Tmax against the processing temperature is the check.
Our expandable microsphere testing service
Our laboratory provides expandable microsphere testing across the full method stack — ISO 11359 TMA for the expansion curve and the Tstart / Tmax / Dmax parameters, ISO 11357 DSC for the shell-polymer transitions and the foamed-matrix crystallinity, ISO 11358 TGA for the composition breakdown and the yielded-gas volume, SEM for the expanded-microsphere morphology and the foamed-matrix cell structure, and the ASTM / ISO mechanical-test set for tensile, impact, bending and density of the foamed specimens. Each project begins with a scoping step that confirms whether the project is free-expansion verification of an as-received lot, in-matrix characterization of a trial foam, or a complete grade-selection-and-process-window study, and maps the test programme to the corresponding methods.
We verify the Tstart, Tmax and Dmax of the lot against the manufacturer's datasheet under ISO 11359; characterize the shell polymer and the blowing-agent endotherm under ISO 11357; determine the blowing-agent content and the yielded-gas volume under ISO 11358; examine the expanded-microsphere morphology and the foamed-matrix cell structure under SEM with image analysis of cell size and cell density; and run the tensile, impact, bending and density tests on the foamed specimens under ASTM D638 / D256 / D790 and the Archimedes method. Reports are issued with the method standard, the measured value, the datasheet or control value, and the conformity conclusion explicitly stated, with the SEM images and the expansion curves included where the result depends on them, in a format suitable for lot-acceptance, grade-selection, process-window qualification or failure investigation.
To start a project, send us the microsphere grade and the manufacturer's datasheet, the matrix material and its processing-temperature window, the application (lightweighting, surface texture, insulation, syntactic foam), and whether the project is lot verification, trial-foam characterization, or a full grade-selection study. We will return a project scope, sample requirement, schedule and quotation, and begin testing on your confirmation.