Soybean testing provides critical performance data that enables farmers to make informed variety selection decisions. These tests evaluate yield potential, stress resistance, and agronomic traits across diverse environments to identify varieties best suited for specific production systems.
This comprehensive guide covers all major soybean testing methods, from replicated small-plot trials to on-farm large strip-plot demonstrations. You'll learn how to interpret testing data, understand statistical measures, and apply selection criteria for choosing high-yielding varieties with resistance to biotic and abiotic stressors.
What you'll learn in this guide:
- Types of soybean variety testing methods
- Statistical interpretation of trial results
- Resistance screening for biotic and abiotic stressors
- Multi-location evaluation strategies
- Data-driven variety selection approaches
- Understanding maturity groups and adaptation
- Quality traits and seed health testing
- Using testing data for profitable decisions
Importance of Soybean Testing
Soybean variety selection significantly impacts farm profitability. Seed companies and university breeding programs continually develop new varieties with improved yield potential and enhanced resilience. Testing programs provide the objective data needed to evaluate genetic performance.
Key benefits of soybean testing:
Objective evaluation: Testing provides unbiased performance data across multiple environments, allowing fair comparisons between varieties from different companies.
Risk management: Multi-location testing identifies varieties with consistent performance, reducing the risk of poor yields in unpredictable conditions.
Stress resistance: Specialized screenings evaluate resistance to yield-limiting factors like nematodes, diseases, and chloride toxicity.
Cost optimization: Data-driven selection helps farmers choose varieties that maximize return on seed investment.
Adaptation matching: Testing across diverse locations identifies varieties adapted to specific soil types, climates, and production systems.
Types of Soybean Variety Testing
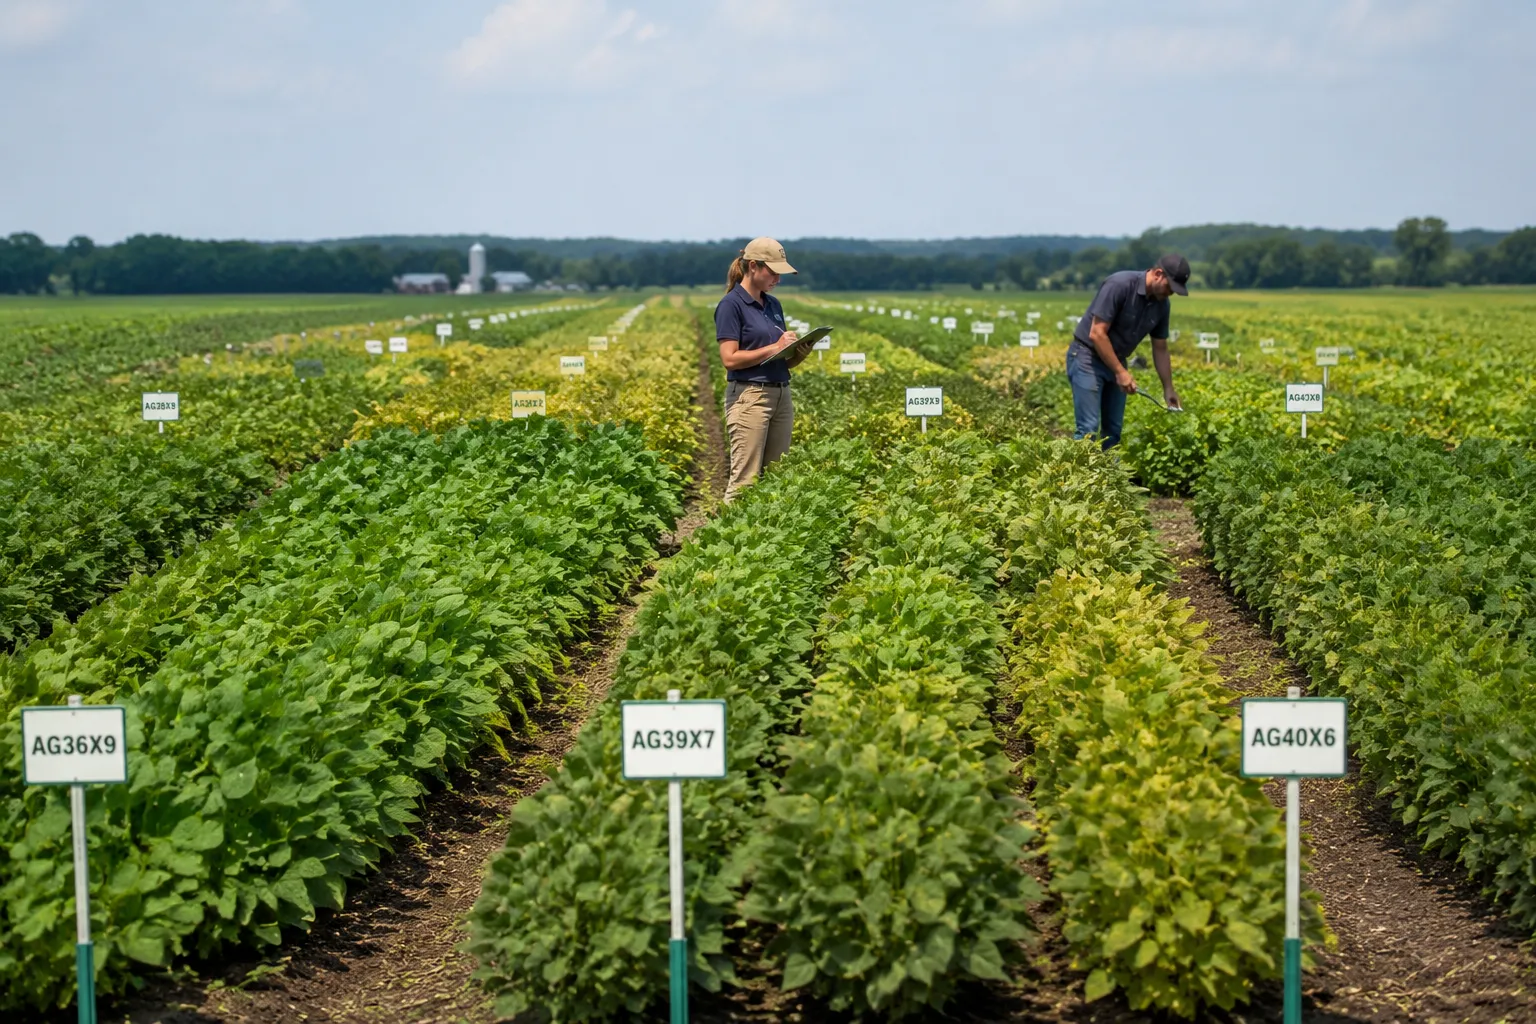
Replicated Small-Plot Trials
Replicated small-plot trials, often called official variety trials (OVTs), provide rigorous scientific evaluation of soybean varieties.
Trial Design:
Small-plot trials typically use:
- Two to four rows per plot
- Plot lengths of 15-30 feet
- Multiple replications per location (usually 3-4)
- Randomized complete block design
Advantages:
- Statistical rigor: Multiple replications enable robust statistical analysis
- Variety separation: Statistical methods determine significant yield differences
- Error detection: Replication identifies experimental errors and field variability
- Many varieties: Allows evaluation of dozens of entries per location
- Controlled conditions: Standardized management reduces non-genetic variation
Limitations:
- Small plot size: May not fully represent commercial field conditions
- Research station settings: Often conducted under optimal management
- Limited locations: Costs constrain geographic coverage
Statistical Measures:
Least Significant Difference (LSD): Minimum yield difference needed to declare varieties significantly different. If two varieties differ by more than the LSD value, genetic factors likely cause the difference rather than environmental noise.
Coefficient of Variation (CV): Measures yield variation within a test. Lower CV values indicate higher quality results. Values below 10% suggest consistent, reliable data.
P-value: Probability that observed differences result from treatments rather than chance. A p-value of 0.05 indicates 95% confidence that differences are real.
Standard Deviation (SD): Measure of variation within location data. Higher SD generally leads to larger LSD values.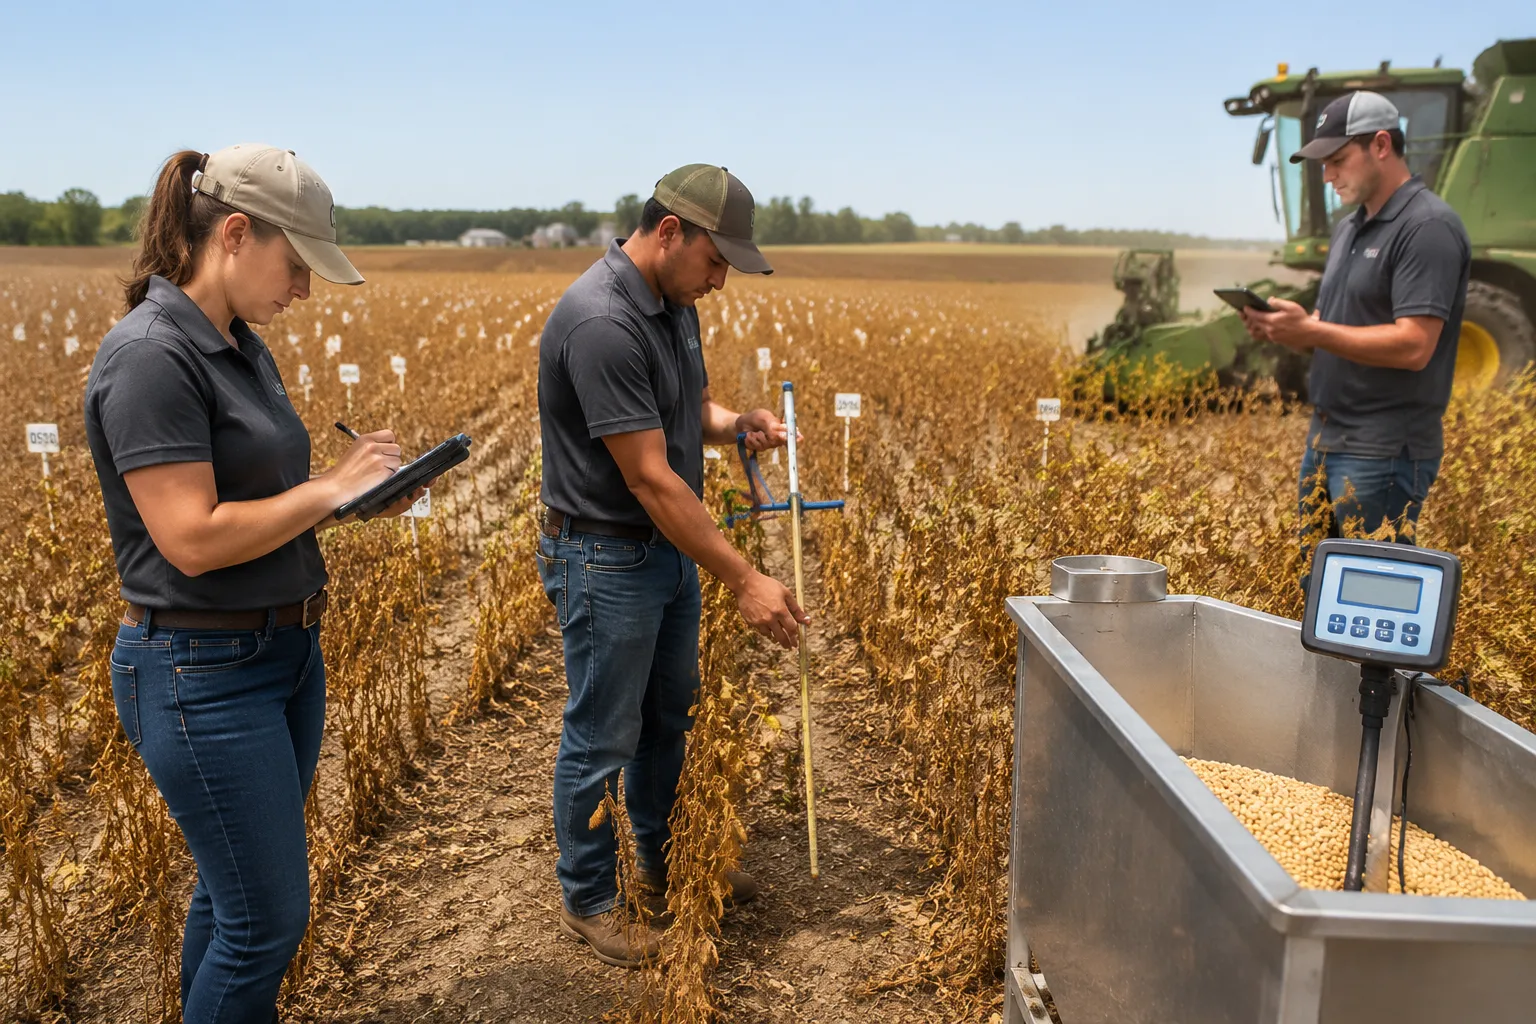
Unreplicated On-Farm Large Strip-Plot Demonstrations
Strip-plot demonstrations evaluate varieties under commercial production conditions in farmer fields.
Trial Design:
- Single strips covering full field length
- Width matches planting equipment
- No replication within location
- Multiple locations for across-site comparison
Advantages:
- Real-world conditions: Reflects actual farmer production practices
- Geographic diversity: Easier to establish many locations
- Farmer trust: Local demonstrations build credibility
- Large scale: Shows variety performance at commercial scale
- Stress identification: Exposes varieties to natural stress patterns
Limitations:
- No statistical separation: Cannot calculate LSD within location
- Field variability: In-field variation affects strip performance
- Limited varieties: Space constraints limit entry numbers
- No replication: Cannot detect or correct plot-level errors
Interpreting Strip-Plot Data:
Performance comparisons rely on:
- Location average comparison
- Multi-location averages
- Consistency across sites
- Relative performance rankings
Multi-Location Testing Strategy
Evaluating varieties across multiple locations and years provides the most reliable performance prediction.
Why Multi-Location Testing Matters:
Genotype by Environment Interaction (G×E): Yield expression depends on environmental conditions. A variety performing well at one location may struggle elsewhere due to G×E interactions.
Environmental diversity: Different locations represent varied soil types, weather patterns, disease pressures, and management practices.
Risk mitigation: Varieties with consistent multi-location performance reduce production risk in unpredictable seasons.
Adaptation zones: Multi-location testing identifies regional adaptation patterns for variety placement.
Minimum Recommendations:
- Test across minimum 4-6 locations
- Include multiple years when possible
- Represent target production environments
- Ensure adequate replications per site
- Use consistent data collection methods
Statistical Interpretation of Test Results
Understanding Test Statistics
Proper interpretation of variety trial results requires understanding statistical measures.
Yield Data:
Mean yield: Average performance across replications at a location
Across-location average: Simple average of location means
Best Linear Unbiased Estimate (BLUE): Advanced statistical estimate adjusting for location effects
Significance Testing:
The LSD determines whether yield differences reflect true genetic differences:
- Difference exceeds LSD → Significant difference (genetic factors)
- Difference less than LSD → No significant difference (environmental noise)
Example Interpretation:
If LSD = 5 bu/ac at p = 0.10 level:
- Variety A: 60 bu/ac
- Variety B: 55 bu/ac
- Difference: 5 bu/ac
- Result: Varieties are significantly different with 90% confidence
Bold Values Convention:
In many variety trial reports, yields in bold indicate varieties not significantly different from the highest-yielding entry. This helps identify top-performing varieties even if they don't achieve the absolute highest yield.
Coefficient of Variation Assessment
CV values indicate test quality and data reliability:
| CV Range | Quality Rating | Interpretation |
|---|---|---|
| < 10% | Excellent | Highly consistent data |
| 10-15% | Good | Acceptable for most decisions |
| 15-20% | Fair | Use with caution |
| > 20% | Poor | Data may be unreliable |
High CV values suggest:
- Weather stress during season
- Field variability issues
- Pest or disease pressure
- Management inconsistencies
P-Value and Confidence Levels
Common Significance Levels:
- p = 0.05 (95% confidence): Standard for research
- p = 0.10 (90% confidence): Often used in variety trials
- p = 0.25 (75% confidence): Less stringent screening
Lower p-values increase confidence in results but may miss real differences (Type II error). Higher p-values detect more differences but increase false positives (Type I error).
For variety selection, p = 0.10 provides reasonable balance between detecting real differences and avoiding false conclusions.
Resistance Screening for Biotic Stressors
Southern Root-Knot Nematatode Screening
Southern root-knot nematode (Meloidogyne incognita) causes significant soybean yield losses in affected regions.
Screening Methods:
- Field trials on infested soils
- Soil population density monitoring
- Root egg count assessment
- Yield evaluation under pressure
Resistance Ratings:
| Rating | Description | Yield Impact |
|---|---|---|
| Resistant | Limits nematode reproduction | Minimal yield loss |
| Moderately Resistant | Some reproduction control | Acceptable yield under moderate pressure |
| Susceptible | Supports reproduction | Significant yield loss in infested fields |
Interpreting Screening Data:
Resistance labels don't guarantee field performance. Some varieties labeled resistant may support nematode reproduction. Evaluate:
- Nematode reproduction rates
- Yield under pressure
- Consistency across locations
- Population density changes
Management Integration:
Combine resistant varieties with:
- Crop rotation
- Nematicide applications
- Soil health management
- Cover crop strategies
Disease Resistance Evaluation
Soybean varieties differ in resistance to major diseases:
Common Disease Screenings:
- Phytophthora root rot
- Sudden death syndrome
- Frogeye leaf spot
- White mold
- Charcoal rot
Rating Systems:
- Visual symptom scoring (0-9 scales)
- Percent affected plants
- Yield under disease pressure
- Lesion size and distribution
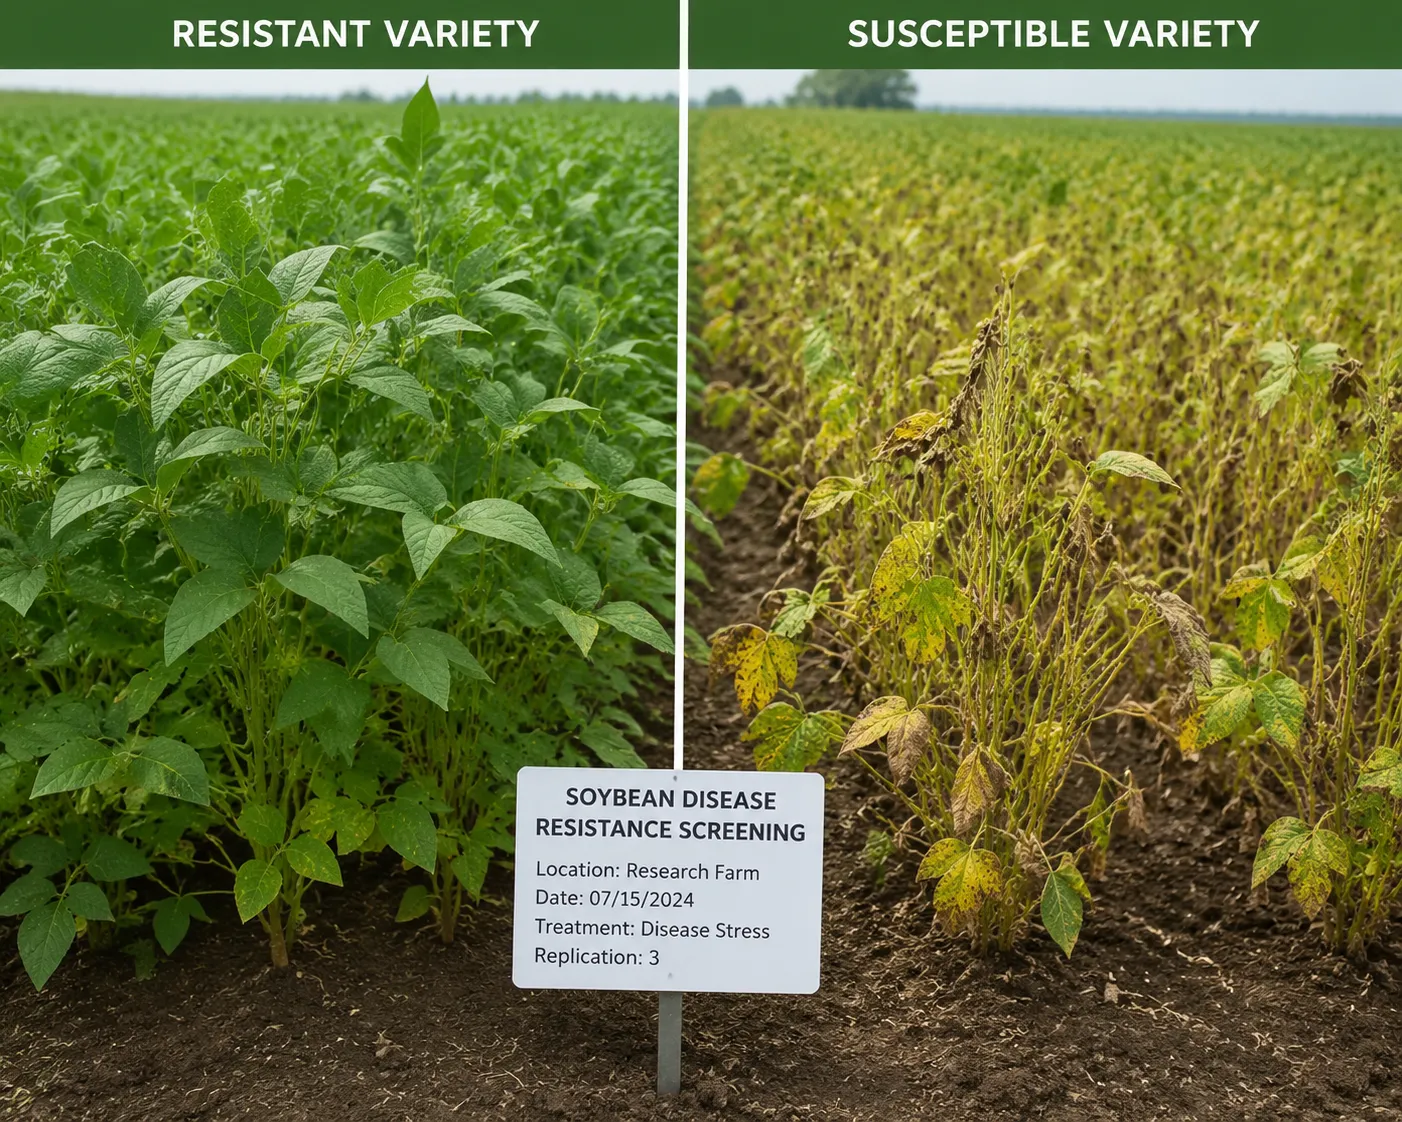
Environmental Influence:
Disease expression depends on weather conditions. Multi-location testing across years identifies varieties with stable resistance.
Chloride Toxicity Screening
Chloride toxicity affects soybeans in certain regions, particularly with saline irrigation water.
Screening Protocol:
- Irrigated trials with high-chloride water (~500 ppm)
- Multiple irrigation applications during season
- Visual symptom rating (0-9 scale)
- Yield measurement under stress
Toxicity Symptoms:
- Score 0: No symptoms (resistant)
- Score 1-3: Marginal leaf chlorosis
- Score 4-6: Moderate interveinal chlorosis
- Score 7-9: Severe chlorosis to plant death
Yield Impact:
Strong negative correlation exists between toxicity score and yield. Each unit increase in toxicity score typically reduces yield by 4-5 bu/ac.
Selection Criteria:
In chloride-affected regions, prioritize:
- Varieties with score = 0 (no symptoms)
- High yield under chloride stress
- Consistent performance across locations
- Verified resistance across years
Abiotic Stress Resistance
Drought Tolerance Evaluation
Drought tolerance testing identifies varieties maintaining yield under water stress.
Testing Approaches:
- Rain-fed trials in drought-prone locations
- Managed stress environments with rainfall exclusion
- Irrigation withholding during critical periods
- Comparison of irrigated vs. non-irrigated performance
Performance Indicators:
- Yield stability across water regimes
- Yield reduction percentage under stress
- Canopy temperature differences
- Root system development
- Phenology adjustment capacity
Flooding Tolerance
Some varieties better withstand waterlogging during early growth stages.
Evaluation Methods:
- Controlled flooding trials
- Natural flooding events in trials
- Recovery assessment after water removal
- Root health evaluation
Temperature Stress
Varieties differ in tolerance to heat and cold stress.
Testing Factors:
- Planting date trials (early vs. late)
- Geographic temperature gradients
- Heat wave response during flowering
- Cold tolerance during emergence
Maturity Groups and Regional Adaptation
Understanding Maturity Groups
Soybean maturity groups (MG) indicate relative maturity and photoperiod sensitivity.
MG Classification:
- MG 00-0: Very early, adapted to northern regions (Canada, northern US)
- MG I-II: Early maturity, northern US adaptation
- MG III-IV: Mid-season maturity, central US
- MG V-VI: Late maturity, southern US
- MG VII-X: Very late maturity, tropical regions
MG Testing Structure:
Varieties are typically tested within MG subgroups:
- Early and late divisions within MG
- Separate trials for each MG range
- Geographic matching of MG to location
Selection Considerations:
- Match MG to your latitude and planting date
- Consider full-season vs. early-season options
- Evaluate within appropriate MG testing data
- Account for local adaptation patterns
Regional Performance Testing
University extension programs conduct regional testing tailored to local conditions.
Regional Trial Features:
- Multiple locations within region
- Local soil types and climate zones
- Regional pest and disease pressures
- Standardized protocols across states
Data Access:
- University extension websites
- Annual printed reports
- Downloadable spreadsheets and PDFs
- Online variety selection tools
Additional Agronomic Traits
Plant Height and Lodging
Plant Height:
- Affects harvest efficiency
- Influences pod height and losses
- Varies by MG and environment
- Important for equipment setup
Lodging:
- Percent of plants leaning or flat
- Impacts harvest speed and losses
- Increases with height and disease
- Rating: 0% (all erect) to 100% (all flat)
Lodging tendency affects:
- Harvest efficiency
- Grain quality
- Pod shatter losses
- Disease development
Seed Quality Traits
Protein and Oil Content:
- Determined by NIR spectroscopy
- Reported at 13% moisture basis
- Affects end-use value
- Influenced by genetics and environment
Typical ranges:
- Protein: 34-42%
- Oil: 18-22%
Quality Factors:
- Seed size and shape
- Hilum color (market preference)
- Seed coat integrity
- Germination and vigor
Disease and Pest Resistance
Evaluate resistance ratings for:
- Soybean cyst nematode
- Phytophthora root rot
- Sudden death syndrome
- Brown stem rot
- White mold
- Stem canker
Resistance ratings indicate:
- Specific resistance genes present
- Field performance potential
- Regional adaptation suitability
Seed Health Testing
Standard Seed Tests
Germination Testing:
- Standard germination percentage
- Cool germination for vigor assessment
- Accelerated aging tests
- Field emergence potential
Physical Purity:
- Pure seed percentage
- Inert matter content
- Other crop seeds
- Noxious weed seeds
Seed Health Assays:
- Pathogen detection
- Fungal identification
- Bacterial contamination
- Virus screening
Vigor Testing
Vigor tests predict field performance beyond standard germination.
Common Vigor Tests:
- Accelerated aging: Stress test for seed longevity
- Cold test: Germination under stress conditions
- Conductivity test: Membrane integrity assessment
- Tetrazolium test: Seed viability staining
Vigor Importance:
- Predicts emergence under stress
- Identifies seed handling damage
- Indicates storage potential
- Guides planting rate decisions
Tissue Testing for Nutrient Management
Purpose and Benefits
Tissue testing provides in-season nutrient status assessment.
Advantages:
- Detects hidden deficiencies before symptoms
- Supplements soil test data
- Guides in-season applications
- Identifies nutrient uptake issues
Timing Considerations:
- Most rapid nutrient uptake occurs V7-R5
- Sample at consistent growth stages
- Multiple sampling dates reveal trends
- Compare fertilized vs. unfertilized areas
Sampling Protocols
Growth Stages for Sampling:
- Prior to flowering: Early-season status
- Early bloom (R1-R2): Peak demand period
- Prior to pod set (R4): Late-season status
Sample Collection:
- Most recent fully developed trifoliate leaf
- Exclude petiole
- Collect 20-30 leaves per sample
- Same planting date, field, and variety
Sample Handling:
- Use breathable paper bags
- Light washing if contaminated
- Air-dry before shipping
- Ship early in week
- Never use sealed plastic bags
- Never freeze samples
Interpreting Tissue Results
Factors Affecting Interpretation:
- Growth stage at sampling
- Plant part analyzed
- Variety differences
- Environmental conditions
- Soil nutrient availability
Critical Levels:
Compare results to established sufficiency ranges:
- Deficient: Below critical level
- Marginal: Near critical level
- Sufficient: Within optimal range
- Excessive: Above optimal range
Validation Strategy:
Sample over-fertilized reference areas simultaneously with field-representative areas to calibrate interpretation.
On-Site Grading and Inspection
Federal Grain Inspection Standards
Third-party grading services protect producer-processor relationships through impartial evaluation.
Grading Factors:
- Test weight
- Damage (weather, insect, mold)
- Foreign material
- Splits and cracks
- Moisture content
Grade Standards:
USDA Federal Grain Inspection Standards establish:
- Grade requirements (1-5, Sample grade)
- Maximum limits for each factor
- Special grades for conditions
- Grade determination procedures
Rapid On-Site Testing
Modern technology enables real-time quality assessment.
Near-Infrared (NIR) Solutions:
- Immediate protein and oil data
- Moisture determination
- Process optimization
- Harvest decision support
Benefits:
- Reduce specialized equipment needs
- Enable real-time decisions
- Optimize processing and blending
- Support segregation strategies
Data-Driven Variety Selection Strategy
Step-by-Step Selection Process
1. Define Target Environment:
- Identify your MG range
- Determine major stressors present
- List key diseases and pests
- Note soil type and irrigation status
2. Gather Multi-Location Data:
- Access university variety trial results
- Review regional testing reports
- Consult company trial data
- Consider on-farm demonstration results
3. Evaluate Yield Performance:
- Compare yields across multiple locations
- Look for varieties consistently in top group
- Check performance stability
- Consider LSD values for significance
4. Assess Stress Resistance:
- Verify resistance to key stressors
- Check screening trial results
- Confirm resistance labels with data
- Evaluate performance under pressure
5. Consider Agronomic Traits:
- Review plant height and lodging scores
- Check maturity relative to MG
- Evaluate disease resistance package
- Consider seed quality characteristics
6. Calculate Economic Value:
- Compare seed costs
- Estimate yield advantage
- Consider technology fees
- Calculate return on investment
Using Online Selection Tools
Many universities offer user-friendly online variety selection tools.
Tool Features:
- Filter by maturity group
- Select traits of interest
- Compare variety performance
- Generate customized reports
- Access multiple years of data
Best Practices:
- Use data from multiple years
- Include locations similar to your farm
- Apply appropriate trait filters
- Compare several top varieties
- Verify results with local demonstrations
Testing Program Management
University Extension Programs
Land-grant universities conduct unbiased variety testing through extension services.
Program Components:
- Official variety trials at research stations
- On-farm strip-plot demonstrations
- Disease and nematode screening trials
- Regional coordination efforts
Data Availability:
- Annual printed reports
- Online databases and tools
- Extension presentations
- Field day results
Seed Company Testing
Private companies supplement public testing with proprietary trials.
Company Trial Features:
- Commercial product focus
- Regional adaptation testing
- Technology trait evaluation
- Pre-release screening
Integration with Public Data:
Cross-reference company data with university results for comprehensive evaluation.
Farmer On-Farm Testing
Conducting personal trials provides field-specific information.
On-Farm Trial Guidelines:
- Select representative field areas
- Use replicated strips when possible
- Include familiar check varieties
- Record management practices
- Measure yield with calibrated equipment
Benefits:
- Variety performance under your conditions
- Direct comparison to current varieties
- Experience with new products
- Hands-on learning opportunity
Frequently Asked Questions
How many years of data should I use for variety selection?
Whenever possible, use multiple years of data. Multi-year testing better estimates variety performance by capturing year-to-year weather variation. However, since varieties change annually, current-year multi-location data often provides the best available information.
What LSD value should I use?
Most variety trials use LSD at p = 0.10 (90% confidence). This balances detecting real differences with avoiding false positives. For critical decisions, you might use more stringent LSD at p = 0.05 (95% confidence).
How do I interpret bold values in variety trial reports?
Bold yields typically indicate varieties not significantly different from the highest-yielding variety. Any variety with bold yield is statistically in the top-performing group and worthy of consideration.
Should I prioritize yield or stress resistance?
Balance both factors based on your production environment. In high-stress fields, resistance traits may outweigh small yield differences. In optimal conditions, yield potential may take priority. Evaluate yield under stress conditions to understand true value.
How do I choose between early and late maturity varieties?
Match maturity to your planting date and frost risk. Earlier-maturing varieties avoid late-season stress but may sacrifice yield potential. Later varieties maximize growing season but risk fall frost damage. Consider your specific frost dates and harvest schedule.
What's the difference between resistant and tolerant varieties?
Resistant varieties limit pest reproduction or disease development. Tolerant varieties sustain pest pressure or disease infection but maintain yield. Resistance is generally preferable as it reduces pest populations for future seasons.
Conclusion
Soybean testing provides the essential data foundation for profitable variety selection. Understanding testing methods, statistical interpretation, and stress resistance screening enables farmers to make informed decisions that optimize yield while managing production risk.
Combining data from replicated small-plot trials and on-farm strip-plot demonstrations across multiple locations and years provides the most reliable basis for selecting varieties adapted to diverse and unpredictable environmental conditions. Testing data empowers growers to match variety genetics to their specific production systems and stress environments.
Key takeaways:
- Use multi-location data for variety selection decisions
- Understand statistical measures to interpret trial results correctly
- Prioritize stress resistance matching your field challenges
- Balance yield potential with stability and adaptation
- Consider agronomic traits beyond yield alone
- Validate decisions with on-farm trials when possible
- Access university extension resources for unbiased data
The investment in proper variety evaluation pays dividends through improved yields, reduced risk, and better adaptation to local growing conditions. Testing programs serve as invaluable resources for successful soybean production.
Note: This article provides general guidance on soybean testing methods and data interpretation. Always consult local university extension services and variety trial reports for specific recommendations adapted to your region.