What Is Metallographic Analysis?
Metallographic analysis is the study of the microstructure of metals and alloys through microscopic examination of prepared surfaces. It reveals the number, type, distribution, and morphology of phases present in a material — information that directly determines mechanical properties, performance, and reliability. From identifying whether a sample is single-phase or multiphase to classifying invariant reactions as eutectic or peritectic, metallographic analysis serves as the foundational diagnostic tool in metallurgy and materials science.
The method operates on a critical assumption: the observed microstructure faithfully represents the true structure of the sample. When this condition is met, metallography can determine even complex multicomponent phase diagrams, as it has done for systems like the Al–Cu–Mg–Si quaternary phase diagram since the 1920s.
Why Is Metallographic Analysis Important?
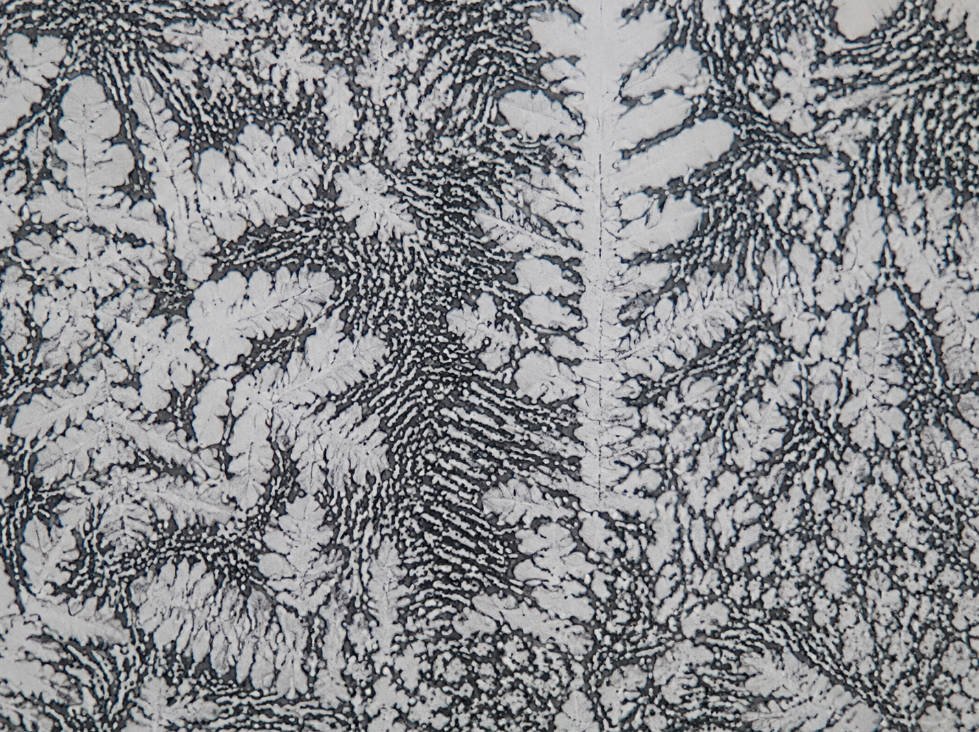
Metallographic analysis matters because microstructure dictates properties. The same chemical composition can yield vastly different hardness, toughness, and corrosion resistance depending on grain size, phase distribution, and defect density — all of which metallography reveals.
-
Quality control: Detects casting defects, welding imperfections, heat treatment failures, and surface contamination such as oxidation
-
failure analysis: Identifies crack initiation sites, intergranular fracture, and brittle phase fallout that cause component failure
-
Phase diagram determination: Establishes phase boundaries, invariant reaction types, and solubility limits — far more efficiently than relying on XRD alone
-
Process optimization: Guides decisions on cooling rates, annealing times, and hardening treatments by correlating microstructure with processing parameters
Without metallographic analysis, engineers would be working blind — unable to see why a material behaves the way it does at the microscopic level.
How to Prepare Samples for Metallographic Analysis?
Proper sample preparation is the single most critical step in metallographic analysis. A poorly prepared surface produces artifacts that can be mistaken for real microstructural features, leading to wrong conclusions.
Sectioning and Mounting
Small samples are typically sectioned from a larger workpiece, then mounted in polymer resin or other embedding materials. Mounting protects the specimen edges during grinding and polishing, and provides a uniform shape for handling.
Grinding and Polishing
The mounted specimen undergoes progressive mechanical grinding followed by polishing:
-
Grinding: Sequential abrasive papers, typically from coarse (e.g., 120 grit) to fine (e.g., 1200 grit), to flatten and smooth the surface
-
Polishing: Final polishing with fine abrasives such as Al₂O₃, Cr₂O₃, Fe₂O₃, MgO, or carborundum paste on a soft cloth to produce a mirror-like, scratch-free surface
In some cases, electrolytic polishing or electro-spark polishing is used instead of mechanical polishing — particularly for soft metals that smear or deform under mechanical action.
Etching
A polished surface appears featureless under a microscope. Etching selectively attacks different phases or grain boundaries to reveal the microstructure. Common etching methods include:
-
Chemical etching: Corrosive agents selectively color or dissolve specific phases — for example, 10% oxalic acid is widely used for stainless steel welds
-
Electrochemical etching: An applied voltage accelerates selective dissolution
-
Magnetic field–assisted etching: Reveals the difference between magnetic and non-magnetic phases
Choosing the right etchant and etching duration is essential — over-etching destroys detail, while under-etching leaves the structure invisible.
What Techniques Are Used in Metallographic Analysis?
Metallographic analysis relies on a hierarchy of imaging and analytical techniques, each providing different levels of information:
|
Technique |
Information Provided |
Typical Resolution |
|---|---|---|
|
Optical Microscopy (OM) |
Phase number, volume fraction, microstructure type, homogeneity |
≤2000× magnification |
|
Surface topology, compositional contrast (backscattered electrons), fine microstructure |
Nanometer scale |
|
|
Energy Dispersive X-ray (EDX) |
Qualitative and quantitative elemental composition, element distribution |
~1 μm |
|
Electron Probe Microanalysis (EPMA) |
High-precision quantitative composition, phase boundaries, tie lines |
1–several μm |
|
Transmission electron microscopy (TEM) |
Fine precipitates, crystal structure, dislocation substructure |
Sub-nanometer |
|
X-ray Diffraction (XRD) |
Phase identification, lattice parameters, texture |
Bulk average |
No single technique provides all answers. Combining methods — for example, OM for overview, SEM/EDX for fine detail and composition, and EPMA for precise tie-line determination — yields the most complete picture.
Optical Microscopy in Metallographic Analysis
Optical microscopy (OM) remains the starting point for every metallographic examination. Despite its age, it provides unique value that electron microscopy cannot fully replace.
Strengths of Optical Microscopy
-
Rapid overview: Scanning from low to high magnification quickly reveals approximate volume fractions, microstructure type, homogeneity, and potential surface contamination
-
Natural color contrast: The contrast mechanism in OM is complex and some phases differentiate more easily under visible light than under electron beams — color differences between phases can be diagnostic
-
Accessibility: Low cost, easy operation, no vacuum required
-
Volume fraction estimation: Representative images can be processed with imaging software to extract area proportions, which convert to volume fractions using known phase densities
Limitations of Optical Microscopy
-
Magnification ceiling: Typically limited to ≤2000×, insufficient for detecting fine precipitates and sub-micron features
-
No compositional data: OM reveals morphology but not chemistry or crystal structure
-
Sample dependency: Requires a well-polished and properly etched surface; artifacts from poor preparation are easily misinterpreted
Many early phase diagrams were determined using OM alone. Even today, an OM examination should always precede electron microscopy — it provides the essential context that guides deeper investigation.
scanning electron microscopy (SEM) and EDX Analysis
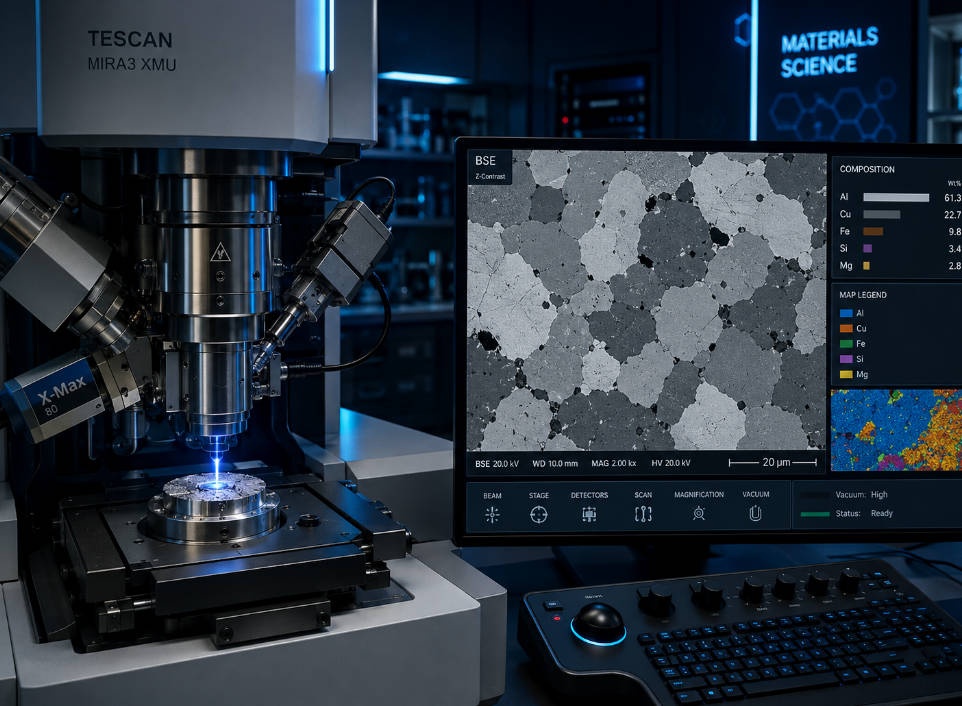
When optical microscopy reaches its limits, scanning electron microscopy (SEM) takes over. SEM uses a focused electron beam rastered across the sample surface, generating multiple signal types that produce different images and analytical data.
Imaging Modes
-
Backscattered electron (BSE) imaging: Contrast arises from differences in average atomic number at each point. Higher atomic number regions appear brighter. This makes BSE imaging a quick compositional screening tool — you can see phase regions before any chemical analysis is performed
-
Secondary electron (SE) imaging: Contrast is dominated by surface topography, with a small contribution from backscattered electrons. SE mode excels at revealing fracture surfaces, porosity, and three-dimensional morphological features
EDX Microanalysis
SEM is almost always coupled with energy dispersive X-ray microanalysis (EDX). When the electron beam excites the specimen, each element emits characteristic X-rays. EDX detects these X-rays and provides:
-
Qualitative identification of elements present in a phase
-
Semi-quantitative composition of individual phases and inclusions
-
Elemental distribution maps showing micro-inhomogeneity and segregation patterns
For phase diagram work, EDX reveals phase compositions and alloying element partitioning. For failure analysis, it identifies corrosion products, contaminant particles, and unexpected inclusions.
Electron Probe Microanalysis (EPMA) for Phase Identification
Electron probe microanalysis (EPMA) is essentially a dedicated SEM equipped with wavelength dispersive spectrometers (WDS). It delivers significantly higher analytical precision than EDX.
How EPMA Works
A focused high-energy electron beam (5–30 keV) strikes the sample, inducing characteristic X-ray emission. WDS separates X-rays by wavelength using analyzing crystals, achieving:
-
Quantitative accuracy: Standard deviation of less than 3% relative for polished bulk specimens when proper matrix correction procedures are applied
-
Detection limits: Approximately 100 ppm — far superior to EDX
-
Spatial resolution: 1 to several microns, depending on beam voltage and average atomic weight
-
Standards-based analysis: Uses pure elements or simple compounds (e.g., MgO, GaP) as references, enabling analysis of virtually any composition except very light elements (Z < 6)
EPMA for Phase Diagram Determination
EPMA is the gold standard for establishing phase boundaries:
-
Three-phase region: Only one alloy within the three-phase region is needed — the beam analyzes the composition of each phase grain directly, defining the entire three-phase triangle
-
Two-phase equilibria: Grains of each phase are selected and analyzed, yielding tie lines directly
-
This is far less time-consuming than XRD-based methods, which require many alloys to trace lattice constant vs. composition curves
When two phase compositions are very close, EPMA tie-line accuracy decreases. In such cases, combining EPMA with XRD and metallography gives the most reliable phase boundaries.
What Are the Applications of Metallographic Analysis?
Metallographic analysis spans virtually every field that involves metallic materials. Key applications include:
Phase Diagram Determination
Metallography identifies the number of phases, invariant reaction types, and the sequence of phase formation during solidification. It reveals whether a composition is hypoeutectic, hypereutectic, hypoeutectoid, or hypereutectoid — information XRD alone cannot provide.
Welding and Joining
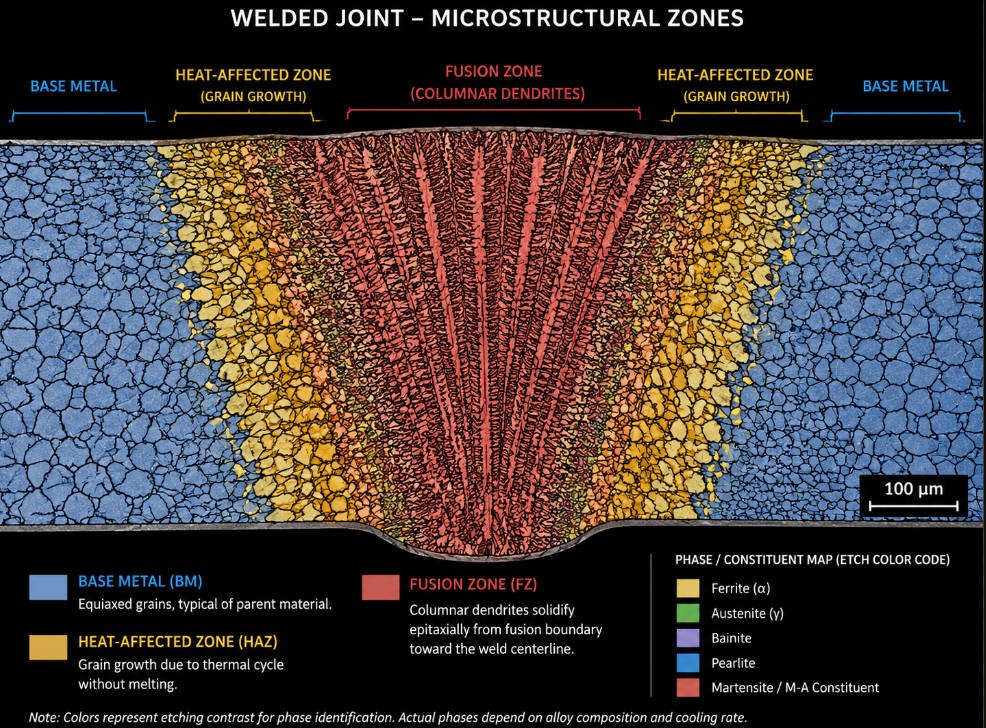
Metallographic examination of weld cross-sections reveals:
-
Fusion zone microstructure and heat-affected zone (HAZ) width
-
Defect detection: Cracks, porosity, incomplete penetration, and intermetallic formation at interfaces
-
Process optimization: Correlating weld parameters (e.g., tool rotational speed in friction welding, laser-arc offset in hybrid welding) with microstructural quality
For example, in friction welding of Cu-tube to Al-tube plate, metallographic analysis showed that 1120 rpm produced optimal metallurgical bonding, while 900 rpm left discontinuous joints and 1400 rpm caused excessive distortion.
Surface Hardening and Heat Treatment
Metallographic cross-sections combined with micro-hardness profiling characterize case depth, effective hardening depth, and hardness gradients in surface-hardened components such as gears. Empirical formulas (Tobe's, Lang's, Thomas's) estimate hardness profiles during design, but metallographic verification remains essential.
Failure Analysis
Metallographic examination of failed components reveals:
-
Crack paths (transgranular vs. intergranular)
-
Brittle phase fallout during sample preparation (indicating intergranular weakness)
-
Quench-induced cracking at grain boundaries
-
Corrosion penetration depth and morphology
Quality Assurance and Certification
Many industrial standards require metallographic evidence — from grain size ratings in ASTM E112 to inclusion content assessment in steels. Metallography provides the visual proof that material specifications are met.
What Are the Limitations of Metallographic Analysis?
Despite its power, metallographic analysis has important limitations that practitioners must understand:
Inability to Detect Fine Precipitates
Many terminal solid solutions exhibit decreasing solubility with decreasing temperature. After homogenization, low-temperature annealing, and quenching, precipitates may be so small that even SEM cannot detect them. Only transmission electron microscopy (TEM) can clearly identify these nanoscale features. Ample annealing time must be provided to allow precipitation to proceed to a detectable scale.
Brittle Phase Fallout
For samples containing brittle phases, the second phase may fall out during grinding and polishing, leaving voids that are misinterpreted in volume fraction analysis. Additionally, brittleness can cause intergranular cracking during quenching, reducing the chance of detecting quenched liquid or grain boundary particles. For such materials, XRD is preferred for phase boundary determination.
Surface Representativeness
Metallographic analysis examines a two-dimensional cross-section of a three-dimensional structure. The assumption that this surface represents the bulk is not always valid — macro-segregation, banding, and orientation-dependent features can produce misleading results. Careful examination of the entire sample is essential to confirm microstructural uniformity before drawing conclusions.
Imaging Software Errors
Image analysis software used for volume fraction extraction is prone to error — threshold settings, overlapping phases, and etching contrast variations all introduce inaccuracies. Results should always be cross-checked with other methods, such as XRD or manual point counting.
Not a Standalone Technique
Metallography identifies phases by morphology and contrast, not by crystal structure or definitive chemistry. For unambiguous phase identification, it must be combined with XRD, EDX, or EPMA.
Metallographic Analysis vs. XRD: Which One to Choose?
Both metallography and XRD are essential for phase analysis, but they serve different purposes:
|
Feature |
Metallographic Analysis |
X-ray Diffraction (XRD) |
|---|---|---|
|
Phase identification |
By morphology and contrast (indirect) |
By crystal structure (definitive) |
|
Composition measurement |
Via EPMA/EDX (spatially resolved) |
Lattice parameter trends (averaged) |
|
Invariant reaction type |
Yes — eutectic, peritectic visible |
No — only phase identification |
|
Volume fraction |
Sensitive, even for trace phases |
Less sensitive to small fractions |
|
Quenched liquid detection |
Superior — characteristic microstructure |
Poor — spectrum only |
|
Fine precipitates |
May miss nanoscale precipitates |
Can detect if present in sufficient volume |
|
Brittle phases |
Risk of fallout during preparation |
No preparation artifacts |
|
Speed for phase boundaries |
EPMA: one alloy per three-phase region |
Many alloys needed for lattice constant curves |
|
Spatial information |
Full microstructural context |
Bulk average only |
The best practice is to combine both methods. Metallography reveals what XRD cannot — the spatial arrangement, sequence of formation, and reaction types — while XRD provides definitive crystallographic phase identification that metallography alone cannot confirm.
In-Situ and Dynamic Metallographic Observation
Metallographic analysis is no longer limited to static, post-mortem examination. Dynamic observation of phase changes can now be achieved by installing heating and cooling stages on optical microscopes or SEM instruments.
In-situ metallographic investigation provides real-time information on:
-
Solid-state phase transformations: Watching martensite form, precipitates dissolve, or recrystallization proceed during heating
-
Melting and solidification: Observing nucleation, dendrite growth, and eutectic formation as temperature changes
-
Crystallization kinetics: Measuring growth rates and transformation velocities directly
This capability transforms metallography from a diagnostic snapshot into a dynamic process monitoring tool, bridging the gap between equilibrium phase diagrams and real-world thermal histories.