What Is Fracture Analysis of Metals?
Fracture analysis of metals is the systematic examination of broken components to determine why and how the failure occurred. By studying the fracture surface — its shape, texture, and features — analysts can identify the fracture origin, crack propagation direction, failure mechanism, and contributing factors such as material defects or environmental damage.
The discipline, known as fractography, has been practiced for centuries. As early as 1540, Vannoccio Biringuccio documented fractographic techniques in "De La Pirotechnia." In 1722, Réaumur published engravings of macroscopic and microscopic fracture surfaces of iron and steel. The invention of the scanning electron microscope (SEM) in 1943 revolutionized the field, expanding resolution by more than one order of magnitude and depth of focus by more than two orders of magnitude compared to optical microscopes.
Today, fracture analysis combines macroscopic observation, microscopic examination, chemical analysis, mechanical testing, and fracture mechanics calculations into a comprehensive root-cause investigation. The goal is always the same: understand what went wrong so you can prevent it from happening again.
Why Is Fracture Analysis Critical for Metal Components?
Metal fractures in safety-critical industries can cost lives, destroy assets, and trigger legal liability. In automotive, aerospace, marine, and infrastructure applications, material failure is not just an inconvenience — it is a catastrophe waiting to happen.
The consequences of metal fracture include:
-
Loss of life — Fractured components in aircraft, trains, and pressure vessels can cause fatal accidents.
-
Financial losses — Unplanned downtime, equipment replacement, and warranty claims.
-
Legal ramifications — Product liability lawsuits and regulatory penalties.
-
Recurring failures — Without root-cause analysis, the same failure repeats.
More than 70% of fractures in mechanical structures are fatigue fractures, which develop gradually under repeated loading. These failures give no visible warning before catastrophic separation — making post-failure analysis essential for prevention.
The cost of failure analysis almost always falls far below the cost of service failures. A single investigation can prevent dozens of future incidents.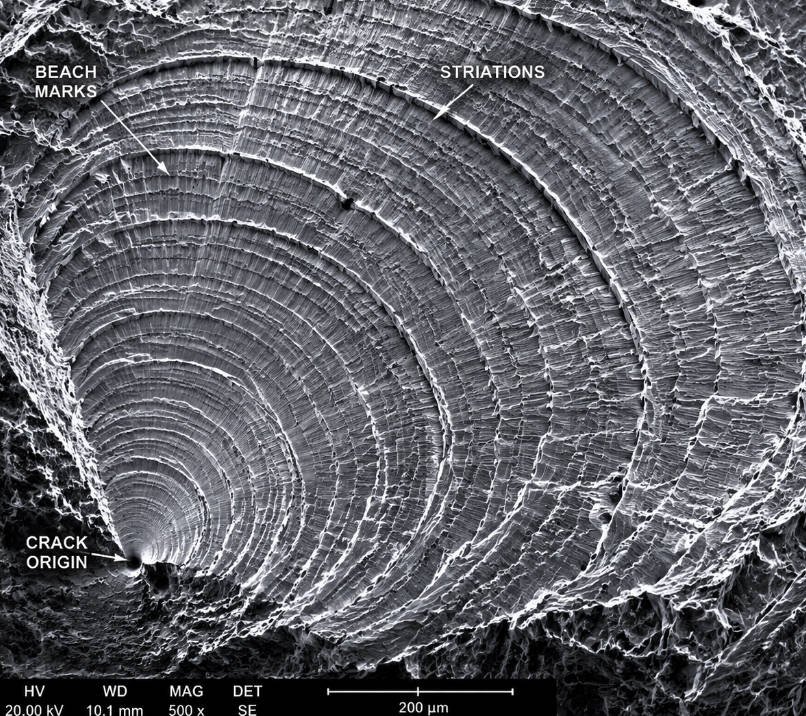
What Are the Main Types of Metal Fractures?
Metal fractures fall into four primary categories, each with distinct mechanisms, surface features, and prevention strategies. Identifying the fracture type is the first step in any failure analysis.
Ductile Fracture
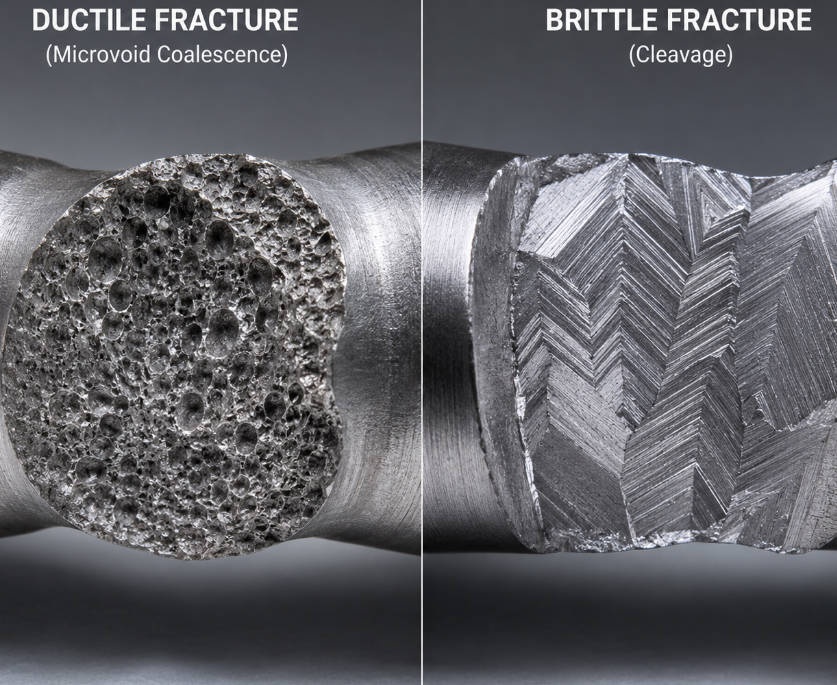
Ductile fracture occurs after significant plastic deformation — stretching, necking, and tearing. The material yields before breaking, absorbing substantial energy in the process.
Macroscopic features:
-
Shear lips at the fracture edges
-
Dull, greyish-white appearance
-
Obvious deformation (necking, dimensional change)
Microscopic features:
-
Microvoid coalescence — Small voids nucleate at inclusions or second-phase particles, grow under stress, and coalesce to form the fracture.
-
Dimples — Equiaxed dimples in tensile overload; elongated dimples in shear overload.
Ductile fractures typically result from overloading or under-designing. They are the expected failure mode when applied stress exceeds the material's yield strength.
Brittle Fracture
Brittle fracture occurs with little or no plastic deformation, often suddenly and at stresses below the yield strength. Crack propagation is rapid, leaving no time for warning.
Macroscopic features:
-
Silver-white, shining reflection
-
Chevron patterns (V-shaped marks pointing toward the origin)
-
Radially spreading cracks
Microscopic features:
-
Cleavage facets — Flat, reflective surfaces formed when the crack follows specific crystallographic planes (common in BCC and HCP metals).
-
River patterns — Lines on cleavage surfaces that converge in the direction of crack propagation.
-
Quasi-cleavage — A mix of cleavage and ductile features, common in heat-treated steels.
-
Intergranular facets — "Rock candy" appearance when cracks follow grain boundaries.
Brittle fractures are particularly dangerous because they occur without warning and can affect normally ductile materials under certain conditions — low temperature, high strain rate, or embrittling environments.
Fatigue Fracture
Fatigue fracture results from repeated cyclic loading at stress levels far below the static yield strength. It is the most common fracture type in engineering structures, accounting for over 70% of all mechanical failures.
Macroscopic features:
-
Beach marks — Semi-elliptical lines perpendicular to the crack growth direction, marking successive positions of the advancing crack front.
-
Ratchet marks — Lines parallel to crack growth, formed where multiple fatigue cracks from different origins intersect.
-
Fish eyes — Circular bright spots indicating the fracture origin.
-
Smooth fracture surface (compared to other fracture types)
Microscopic features:
-
Striations — Semi-elliptical lines emanating from the origin, each representing one stress cycle. Spacing is typically uniform and can be used to calculate crack growth rate.
-
Secondary cracks
-
Rub marks in high-contact areas
Fatigue fractures progress through three stages:
-
Stage I — Crack initiation at a stress concentration site
-
Stage II — Stable crack propagation (striations form here)
-
Stage III — Final rapid fracture when remaining cross-section can no longer sustain the load
Environmental Fracture
Environmental fracture develops under corrosive conditions, sometimes with extremely small external stress. The two most important types are hydrogen embrittlement and stress corrosion cracking.
Hydrogen embrittlement:
-
Also called delayed fracture
-
Hydrogen enters during manufacturing (welding, electroplating) or service (corrosion reactions)
-
Macroscopic: Silver-white shining reflection
-
Microscopic: Granular fracture, hair marks
Stress corrosion cracking (SCC):
-
Common in austenitic stainless steel exposed to chloride ions
-
Transgranular cracking in chloride environments
-
Intergranular cracking in copper, brass, and aluminum alloys
-
Macroscopic: Partial reflection, rusting/discoloration
-
Microscopic: Granular fracture, feathering pattern
|
Fracture Type |
Deformation |
Speed |
Energy Required |
Typical Cause |
|---|---|---|---|---|
|
Ductile |
Large |
Moderate |
High |
Overload |
|
Brittle |
Minimal |
Rapid |
Low |
Low temp, impact, embrittlement |
|
Fatigue |
None (macro) |
Slow growth |
Very low |
Cyclic loading |
|
Environmental |
Minimal |
Slow growth |
Very low |
Corrosion + stress |
How Do You Perform a Fracture Surface Examination?
A systematic fracture surface examination follows a proven 12-step procedure that moves from the general to the specific. Skipping steps or contaminating the fracture surface can destroy critical evidence.
The 12-Step Failure Analysis Procedure
-
Information gathering — Collect service history, loading conditions, material specifications, and circumstances of failure.
-
Preliminary visual examination — Document the failed component as received. Photograph everything before touching.
-
Nondestructive testing — Use ultrasonic, radiographic, or magnetic particle methods to detect subsurface defects.
-
Material characterization — Perform mechanical, chemical, and thermal testing on the base material.
-
Fracture surface selection and preservation — Protect the fracture surface from contamination, oxidation, and mechanical damage.
-
Fracture surface cleaning — Remove debris without altering fracture features. Use appropriate solvents — different solutions for metals versus plastics.
-
Macroscopic examination — Identify fracture origin, propagation direction, and general fracture mode at 1–50× magnification.
-
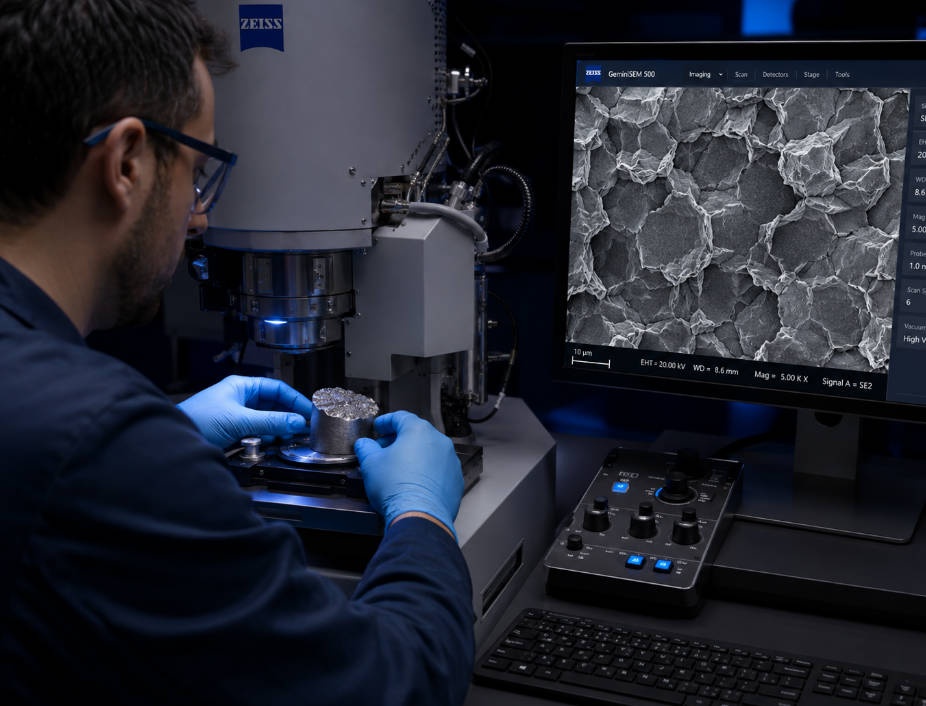
Microscopic examination — Use SEM at 100–5,000× to identify micro-fractographic features (dimples, cleavage, striations, intergranular facets).
-
Cross-section preparation and examination — Metallographic cross sections reveal microstructure, heat treatment, and subsurface defects.
-
Failure mechanism identification — Correlate all evidence to determine the specific failure mechanism.
-
Stress and fracture mechanics analysis — Calculate stress levels, stress intensity factors, or crack growth rates.
-
Data review and reporting — Synthesize all findings into conclusions and actionable recommendations.
Critical Rules for Fracture Surface Handling
-
Never match fracture faces together — this damages microscopic features.
-
Never touch the fracture surface with bare hands.
-
Never clean the surface with abrasive materials.
-
Always photograph before any cleaning or manipulation.
-
Always store fracture surfaces in desiccant bags to prevent oxidation.
What Fractographic Features Reveal the Failure Mode?
Each fracture mechanism produces distinctive features at both macroscopic and microscopic levels. Learning to read these features is the core skill of fractography.
Macroscopic Features
|
Feature |
Description |
Indicates |
|---|---|---|
|
Beach marks |
Semi-elliptical lines on smooth surface |
Fatigue fracture |
|
Chevron pattern |
V-shaped marks pointing to origin |
Rapid brittle fracture |
|
Radial marks |
Lines radiating from origin |
Brittle fracture |
|
Ratchet marks |
Parallel lines from multiple origins |
Multi-origin fatigue |
|
Shear lips |
Slanted edges at 45° |
Ductile overload (final fracture) |
|
Rust/discoloration |
Oxidation on part of surface |
Pre-existing crack, environmental fracture |
|
Mirror zone |
Flat, featureless area at origin |
Brittle fracture initiation |
Microscopic Features
|
Feature |
Description |
Indicates |
|---|---|---|
|
Dimples |
Cup-like depressions |
Ductile fracture (microvoid coalescence) |
|
Cleavage facets |
Flat, reflective planes |
Transgranular brittle fracture |
|
River patterns |
Converging lines on cleavage |
Crack propagation direction |
|
Intergranular facets |
"Rock candy" grain boundary fracture |
SCC, hydrogen embrittlement, temper embrittlement |
|
Striations |
Regular semi-elliptical lines |
Fatigue (one striation = one cycle) |
|
Quasi-cleavage |
Mix of cleavage and ductile tearing |
Heat-treated steel brittle fracture |
|
Hair marks |
Fine lines on granular surface |
Hydrogen embrittlement |
Reading the fracture surface tells a story. Beach marks trace the crack's growth history. Chevron patterns point back to the origin. Striations count the load cycles. The size of the final overload zone reveals the stress level at failure — a small overload zone means the applied stress was low; a large zone means it was high.
How Does Fracture Mechanics Quantify Crack Behavior?
Fracture mechanics provides the mathematical framework to predict when a crack will propagate and how fast it will grow. Four key parameters are used to characterize fracture resistance in metals, each with strengths and limitations.
K-Field (Stress Intensity Factor)
The simplest approach uses fracture toughness KIC as a material property. KIC represents the critical stress intensity at which a crack begins to propagate.
-
Advantage: Simple to calculate; widely available from material suppliers.
-
Limitation: Based on linear elastic theory. In metals with significant plasticity, KIC is only a pseudo-characteristic parameter — it depends on specimen geometry and test conditions.
-
Best for: Quality comparisons, not precise fracture prediction in ductile metals.
J-Integral
The J-integral measures the energy release rate associated with crack extension, accounting for elastic-plastic behavior.
-
Advantage: Theoretically more rigorous than KIC for materials that yield.
-
Limitation: Valid only when path-independent. In large-scale yielding (common in ductile metals like aluminum), the J-integral becomes path-dependent near the crack tip because it includes energy dissipated by plasticity — not just the energy needed to create the fracture surface.
-
Best for: Moderate yielding conditions where small-scale yielding assumptions still approximately hold.
CTOD (Crack Tip Opening Displacement)
CTOD measures the physical opening of the crack tip as load is applied. It is a direct, observable quantity that can be measured using digital image correlation (DIC).
-
Advantage: Does not depend on theoretical assumptions about plasticity. Can be measured directly from experiments. Constant CTOD values are observed for given crack extensions when specimen size is properly chosen — supporting its use as a true material parameter.
-
Limitation: Requires careful specimen design relative to crack length.
-
Best for: The most cost-effective and practical method for characterizing fracture resistance in ductile metals. This is the method most widely used today.
Cohesive Zone Model
The cohesive zone model describes fracture using a constitutive law (cohesive law) that relates traction to displacement across the fracture process zone. It requires three parameters: shape, maximum traction, and critical displacement.
-
Advantage: Theoretically the most complete description of the fracture process. Can model crack initiation, propagation, and final failure.
-
Limitation: Extracting all three parameters from experiments requires iterative FEM simulation — computationally expensive and dependent on multiple assumptions. Multiple parameter combinations may produce similar load-displacement curves, creating non-uniqueness problems.
-
Best for: Research applications and detailed numerical simulations where cost is not the primary constraint.
|
Parameter |
Theoretical Rigor |
Practical Ease |
Cost-Effectiveness |
Best Application |
|---|---|---|---|---|
|
KIC |
Low (elastic only) |
High |
High |
Quality screening |
|
J-Integral |
Moderate |
Moderate |
Moderate |
Moderate yielding |
|
CTOD |
High |
High |
High |
Ductile metals (recommended) |
|
Cohesive Zone |
Very High |
Low |
Low |
Research, detailed FEM |
What Role Do Environmental Factors Play in Metal Fracture?
The service environment can turn a ductile metal into a brittle one — often without any visible warning. Understanding environmental fracture mechanisms is essential for preventing unexpected failures.
Hydrogen Embrittlement
Hydrogen embrittlement (also called delayed fracture) occurs when atomic hydrogen enters the metal lattice and migrates to regions of high triaxial stress. Common sources include:
-
Welding — Moisture in electrodes or shielding gas dissociates into hydrogen.
-
Electroplating — Hydrogen is generated at the cathode during plating.
-
Corrosion reactions — Cathodic hydrogen evolution in acidic environments.
-
Cathodic protection — Overprotection can generate hydrogen at the steel surface.
Hydrogen embrittlement produces intergranular fracture with characteristic "fisheye" patterns — bright, circular areas of brittle fracture on otherwise ductile surfaces.
Stress Corrosion Cracking (SCC)
SCC requires the simultaneous presence of tensile stress and a specific corrosive environment. Key metal-environment combinations:
|
Metal |
Aggressive Environment |
Crack Path |
|---|---|---|
|
Austenitic stainless steel |
Chloride ions (Cl⁻) |
Transgranular |
|
Carbon steel |
Nitrate solutions, hydroxides |
Intergranular |
|
Copper alloys |
Ammonia |
Intergranular |
|
Aluminum alloys |
Chlorides |
Intergranular |
|
Chlorides, methanol |
Transgranular or intergranular |
SCC is particularly insidious because the stress required can be far below the yield strength — residual stresses from fabrication are often sufficient.
Corrosion Fatigue
Corrosion fatigue combines cyclic loading with a corrosive environment, producing crack growth rates orders of magnitude faster than either mechanism alone. Unlike SCC, corrosion fatigue does not require a specific metal-environment combination — any corrosive environment accelerates fatigue.
High-Temperature Fracture
At elevated temperatures, metals experience creep — time-dependent deformation under sustained load. Creep fractures display granular surfaces with dimples and sinkage features. Combined with oxidation, high-temperature environments accelerate both crack initiation and propagation.
How Do You Choose the Right Fracture Analysis Method?
The right analysis method depends on the fracture type, available equipment, budget, and the consequences of the failure. Use this decision framework to select the appropriate approach.
Match the Method to the Failure Type
|
Failure Type |
Primary Analysis Method |
Supporting Methods |
|---|---|---|
|
Ductile overload |
SEM examination (dimples) |
Tensile testing, hardness testing |
|
Brittle fracture |
SEM examination (cleavage/intergranular) |
Charpy impact testing, CTOD |
|
Fatigue |
Macroscopic (beach marks) + SEM (striations) |
S-N curve analysis, crack growth testing |
|
Hydrogen embrittlement |
SEM (intergranular) + hydrogen analysis |
Delayed fracture testing, slow strain rate |
|
Stress corrosion cracking |
SEM + EDX chemical analysis |
SCC testing per NACE standards |
|
Creep fracture |
SEM + metallographic cross-section |
Creep rupture testing |
Choose Your Equipment
|
Equipment |
Magnification |
Depth of Focus |
Best For |
|---|---|---|---|
|
Naked eye / loupe |
1–10× |
High |
Macro features, origin location |
|
Stereo microscope |
1–50× |
High |
Beach marks, chevron patterns |
|
Optical microscope |
50–1,000× |
Low |
Polished cross-sections (not fracture surfaces) |
|
SEM |
20–300,000× |
Very high |
Dimples, cleavage, striations, intergranular |
|
4K Digital Microscope |
1–1,000× |
High (depth composition) |
Uneven fracture surfaces, glare removal |
Advanced Microscopy Solutions for Challenging Surfaces
Metal fracture surfaces present specific challenges for conventional microscopes:
-
Glare — Irregular reflection obscures fine features. Solution: Glare removal functions in digital microscopes suppress unnecessary reflections.
-
Uneven surfaces — Conventional microscopes have shallow depth of field on 3D fracture surfaces. Solution: Real-time depth composition brings the entire surface into focus simultaneously.
-
Shadow variation — Changing angles alter shadows, making consistent observation difficult. Solution: Multi-lighting functions capture omnidirectional lighting data automatically, letting you select the optimal image.
-
Subtle features — Low-contrast fracture patterns require enhancement. Solution: Optical Shadow Effect Mode analyzes contrast under varied illumination, revealing minute irregularities invisible to standard microscopy.
What Standards Govern Fracture Analysis of Metals?
Following recognized standards ensures your fracture analysis results are reliable, repeatable, and defensible. Key standards span testing methods, fracture toughness measurement, and environmental testing.
Fracture Toughness Testing Standards
-
ASTM E399 — Plane-strain fracture toughness (KIC) of metallic materials
-
ASTM E1820 — Measurement of fracture toughness (covers K, J, and CTOD)
-
ASTM E1290 — CTOD fracture toughness measurement
-
ASTM E813 — JIC measurement (a measure of fracture toughness)
-
ISO 12135 — Unified method for determination of K, CTOD, and J
Fatigue Testing Standards
-
ASTM E466 — Force-controlled axial fatigue testing
-
ASTM E606 — Strain-controlled fatigue testing
-
ASTM E647 — Measurement of fatigue crack growth rates
-
ISO 11782 — Fatigue testing of metallic materials
Environmental Fracture Standards
-
NACE TM0177 — Testing for resistance to sulfide stress cracking
-
NACE TM0198 — Slow strain rate testing for SCC
-
ASTM G36 — Stress corrosion cracking in boiling magnesium chloride
-
ASTM G129 — Slow strain rate testing for SCC
Impact Testing Standards
-
ASTM E23 — Notched bar impact testing (Charpy/Izod)
-
ISO 148-1 — Charpy pendulum impact test
Chemical Analysis Standards (for failure investigation)
-
ASTM E572 — XRF analysis of stainless steel
-
ASTM E1508 — EDS analysis in SEM
-
ASTM E2339 — Digital image correlation for strain measurement
Adherence to these standards is not optional for safety-critical applications. Your analysis must be defensible — in court, in front of regulators, and in engineering review boards. Standards provide the framework for credibility.